


By Julien-Pierre Nouen, Director of Economic Studies and Mixed Management at Lazard Frères Guest
 Julien-Pierre Nouen |
ISM indices are one of the indicators that correlate best with GDP growth. These indicators are calculated for the manufacturing and service sectors and are based on surveys sent to a representative sample of companies asking about trends in production, backlogs, staffing, delivery times and prices. These indicators are centered around 50, a low level that generally corresponds to contraction of economic activity. The index for manufacturing has been calculated since 1948, while the index for services has been calculated since 1997.
The chart below shows the average weighting of the ISM indices, with the lowest weighting given to the manufacturing sector, which accounts for 10% of economic activity. The strong contribution of manufacturing to the volatility of the business cycle may justify the higher weighting, but the chart will not be very different.
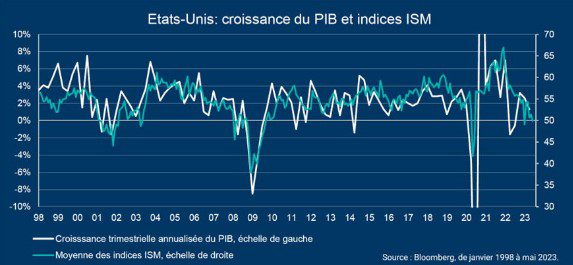
The ISM manufacturing index has been below 50 since October last year and the new orders component reached 42.6, which is typically seen during a recession. The services index rose again in January, but has continued to fall since then. At 50.3, it’s a level rarely seen outside of recessions. Recent trends in the ISM indices seem to reinforce the possibility that the US economy will soon enter a recession.

Herb Brewer is a contributor at Houstonian Online, writing about news, politics, business, technology, sports, entertainment, and lifestyle topics. He is committed to delivering clear, balanced, and informative content that keeps readers updated on current affairs, important developments, and stories relevant to everyday life.