Article Summary
Six calculated scenarios plus an excel file to do it yourself.
Read the full article: Calculating the different scenarios
reading time: 2 Minutes
What are the benefits and risks by age group?
In our article on August 1 A model has been provided to calculate for each age group what the risks are in the second half of 2022 if people are (again) vaccinated against Covid-19. The example calculation in this article is based on two values: the vaccine provides 100% protection and the excess mortality is entirely due to the vaccine.
This results in two numbers:
- How many people will die thanks to vaccination?
- How many people will die from vaccination?
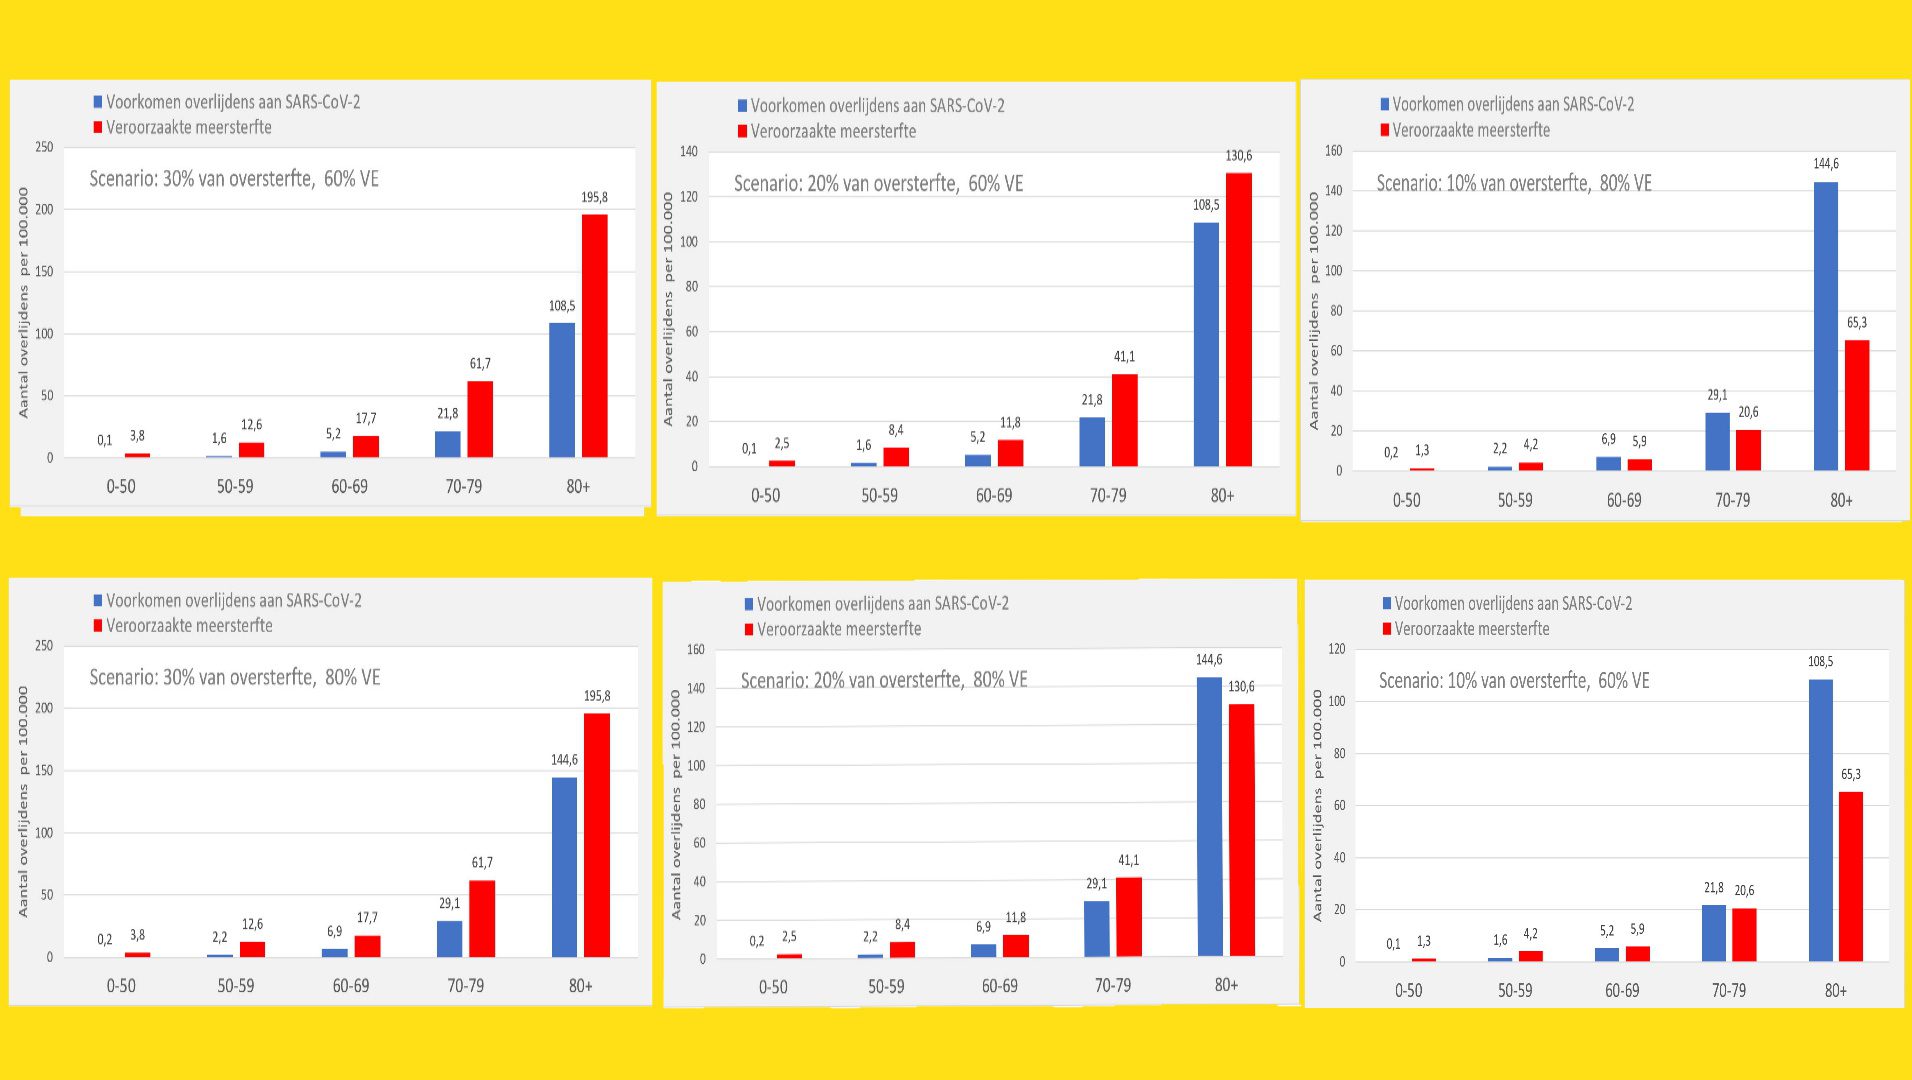
On the website virusvaria.nl Anton Theunissen, in collaboration with the authors of the original article, computed this model with different values of vaccine protection and how high the mortality rate would be due to the vaccine. In this way, it is possible to provide a good idea of the effects of these assumptions on the figures for different age groups.
I recommend that you read this article. Especially to see how different scenarios work for your age group. (Subject to what Written August 1 with model explanation). On the basis of numbers and assumptions, this model was developed.
I also draw your attention to the article on this site which deals with the important difference between the absolute and the relative effect of vaccination.
Here are the results of six scenarios. In both scenarios, the percentage of unexplained deaths that (possibly) due to vaccination are shown in red and putative VE (vaccine efficacy) in blue. The last line then shows an increased chance of dying from vaccination compared to a decreased chance of dying Omicron.
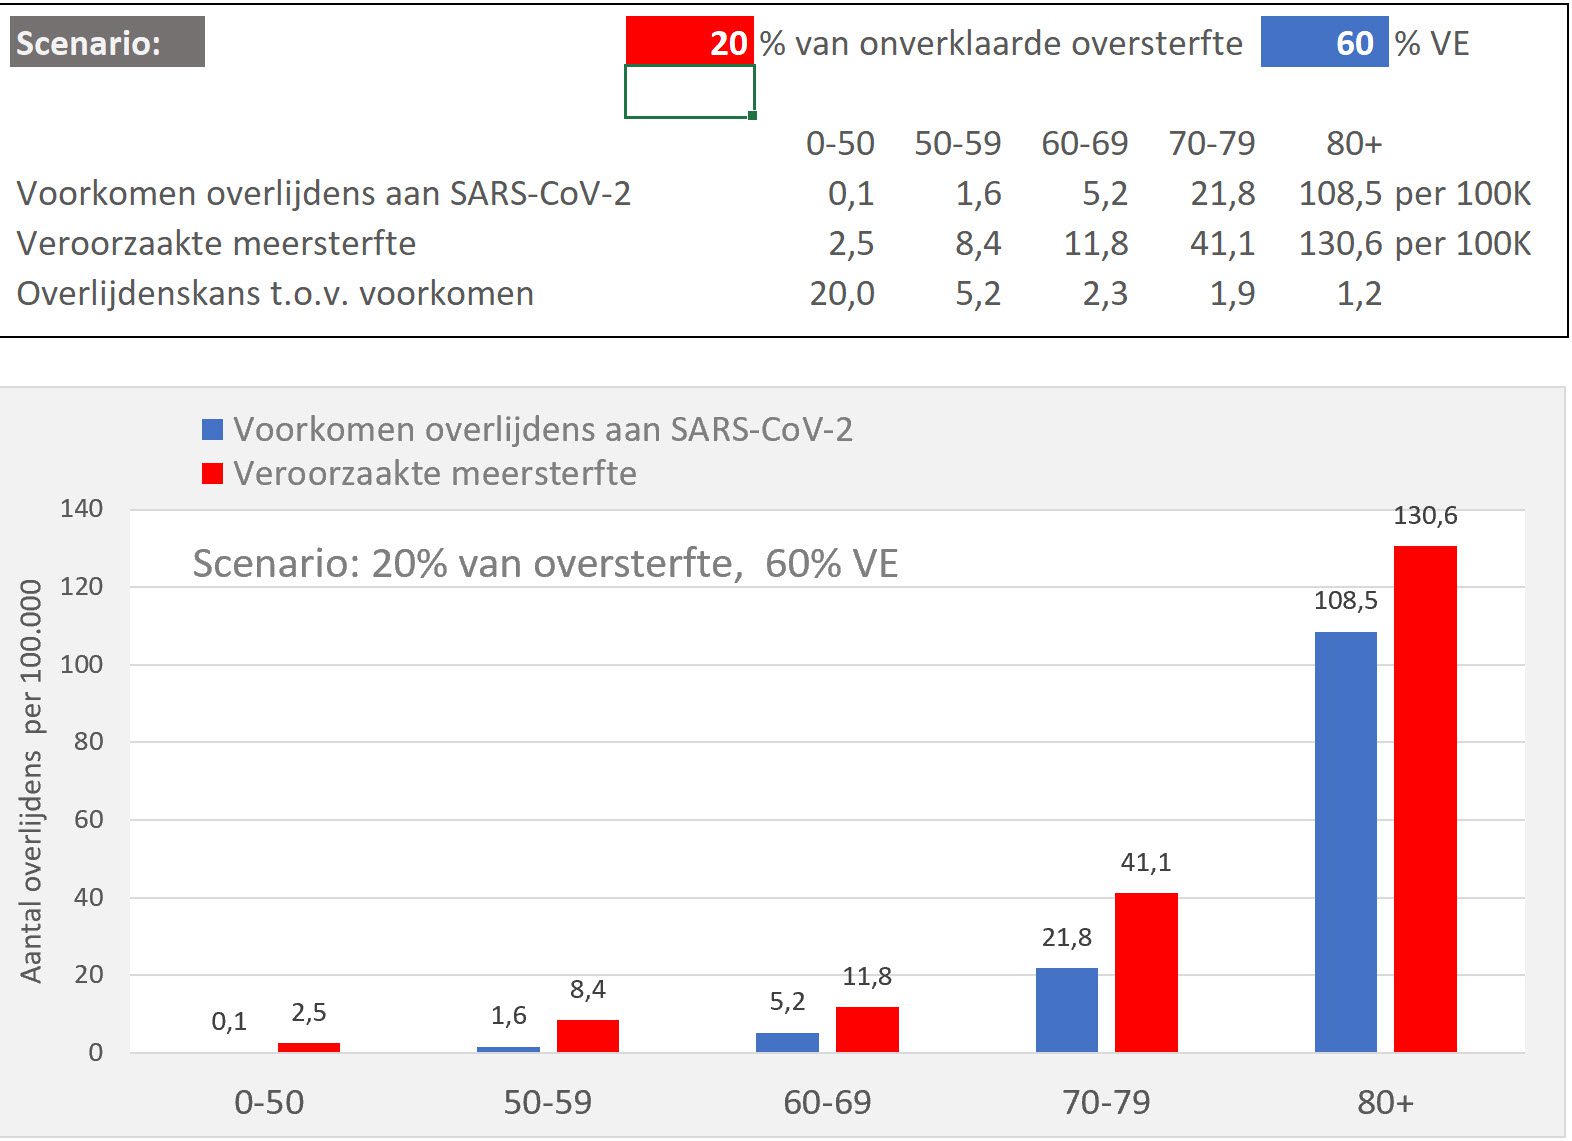
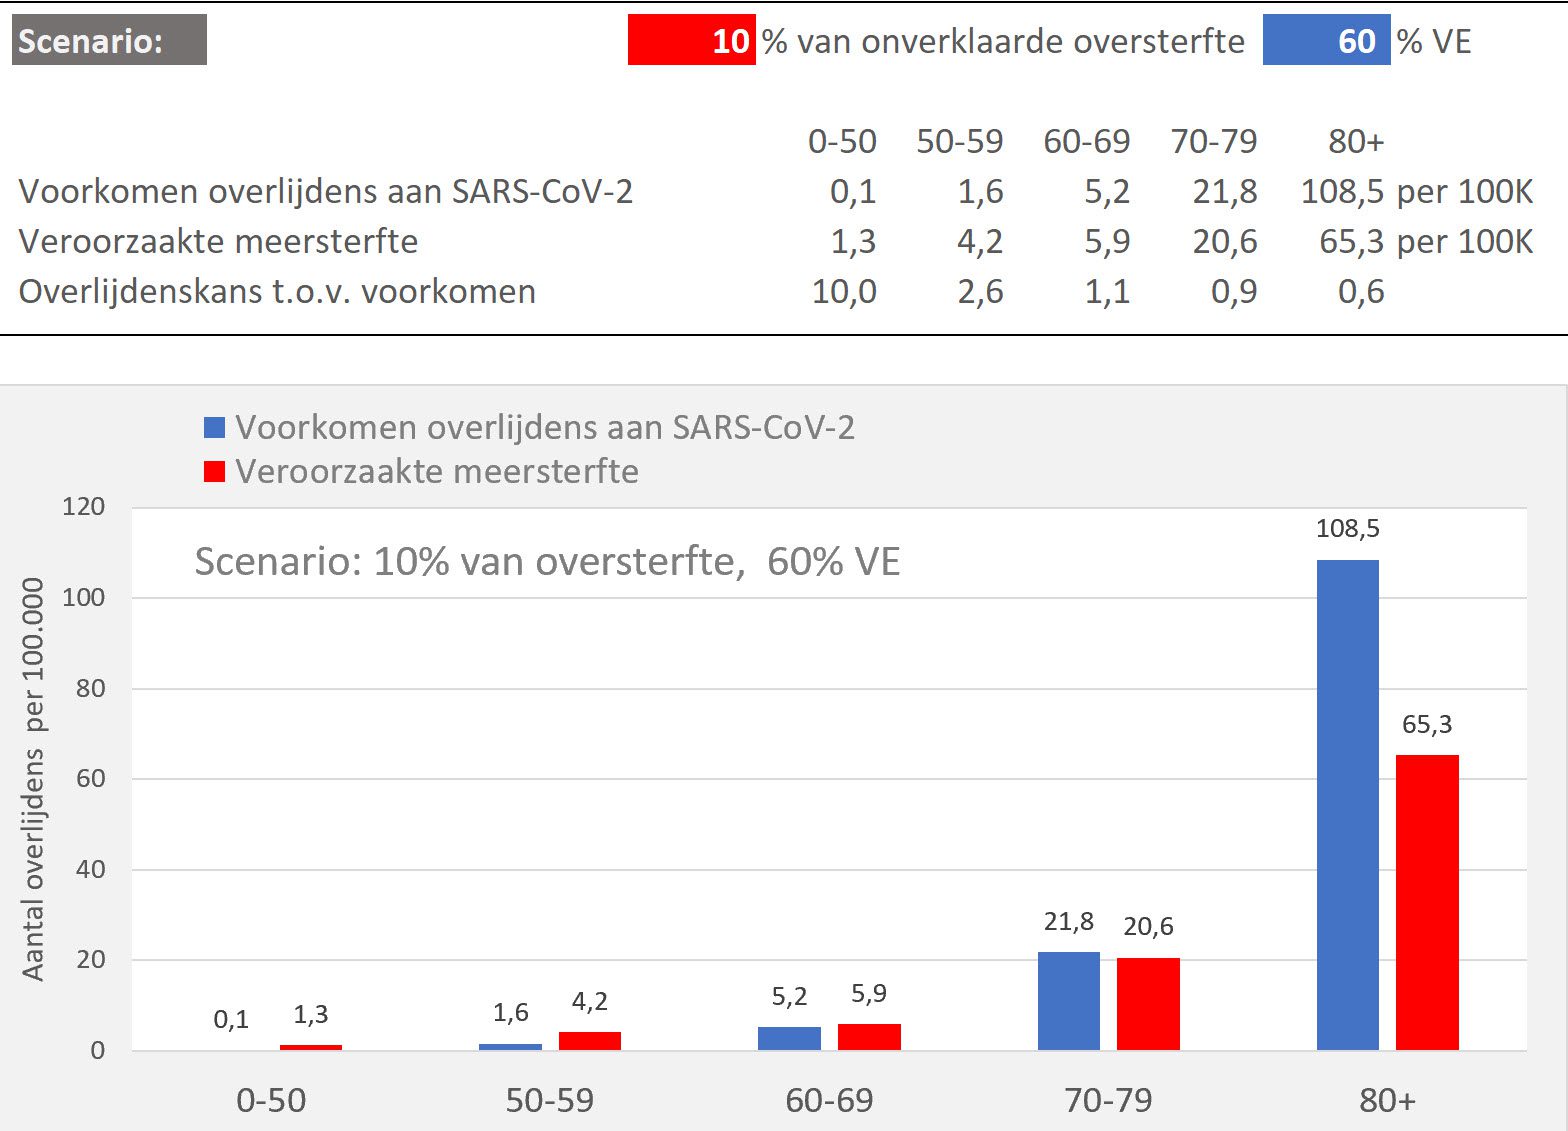
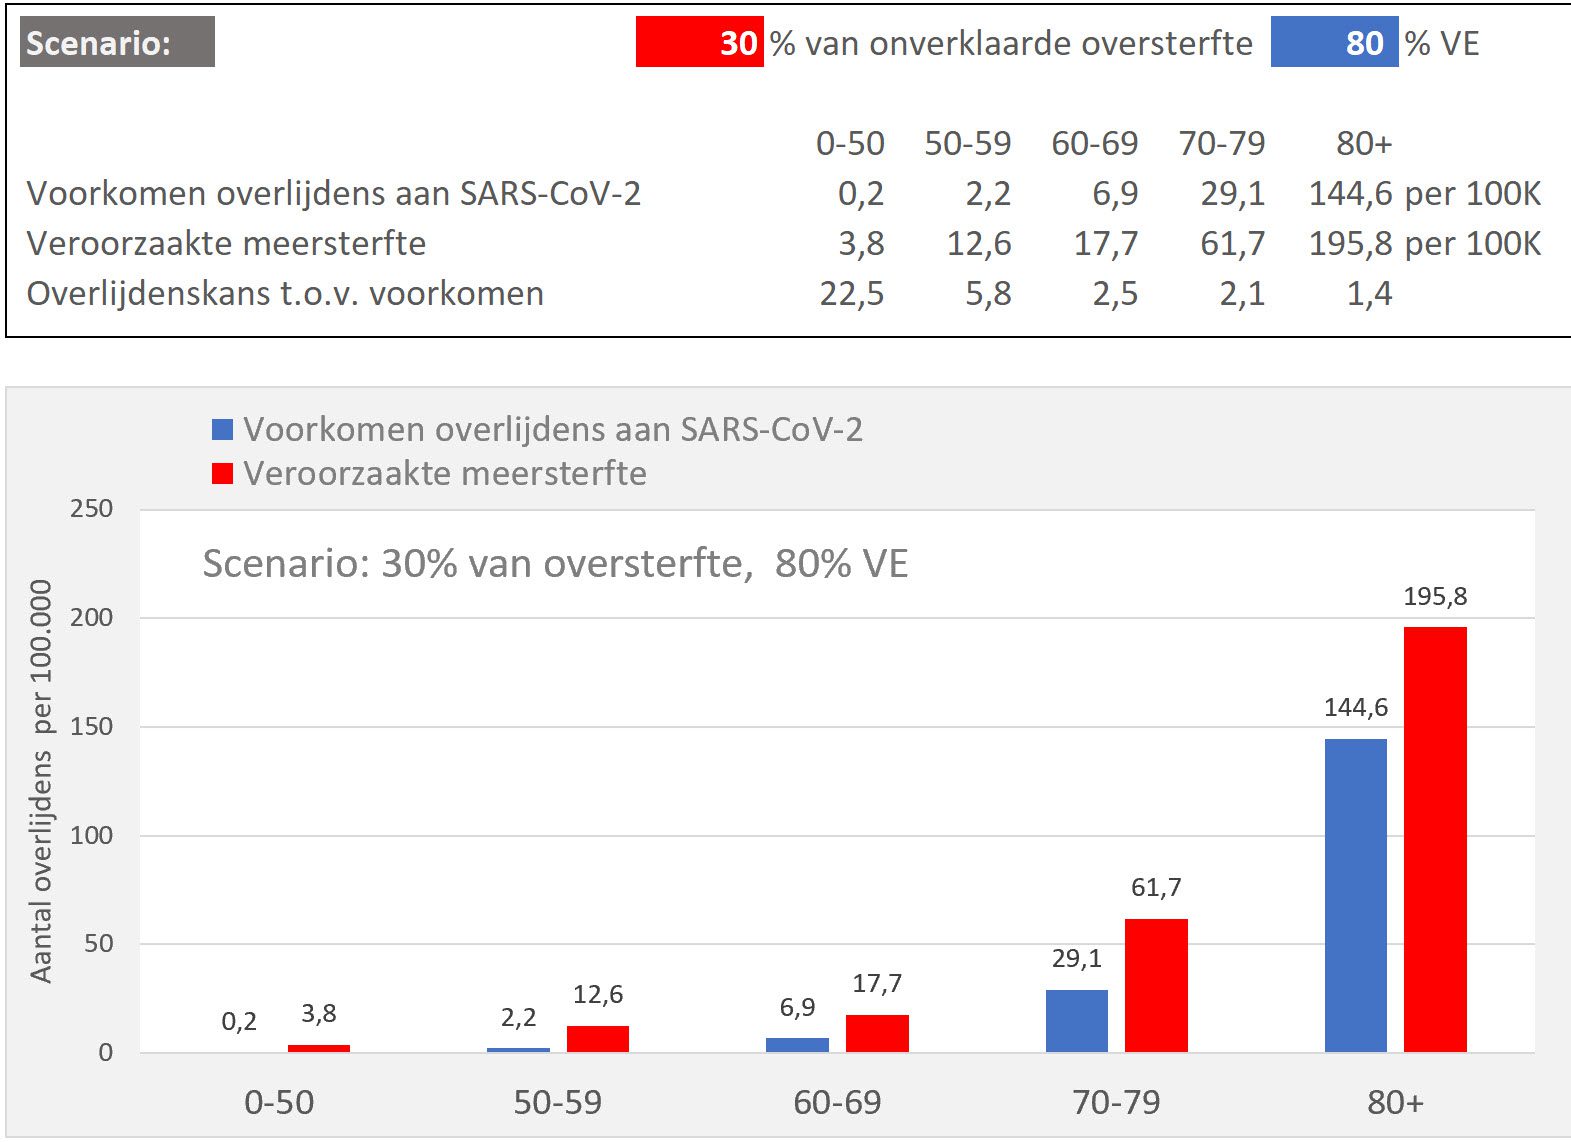
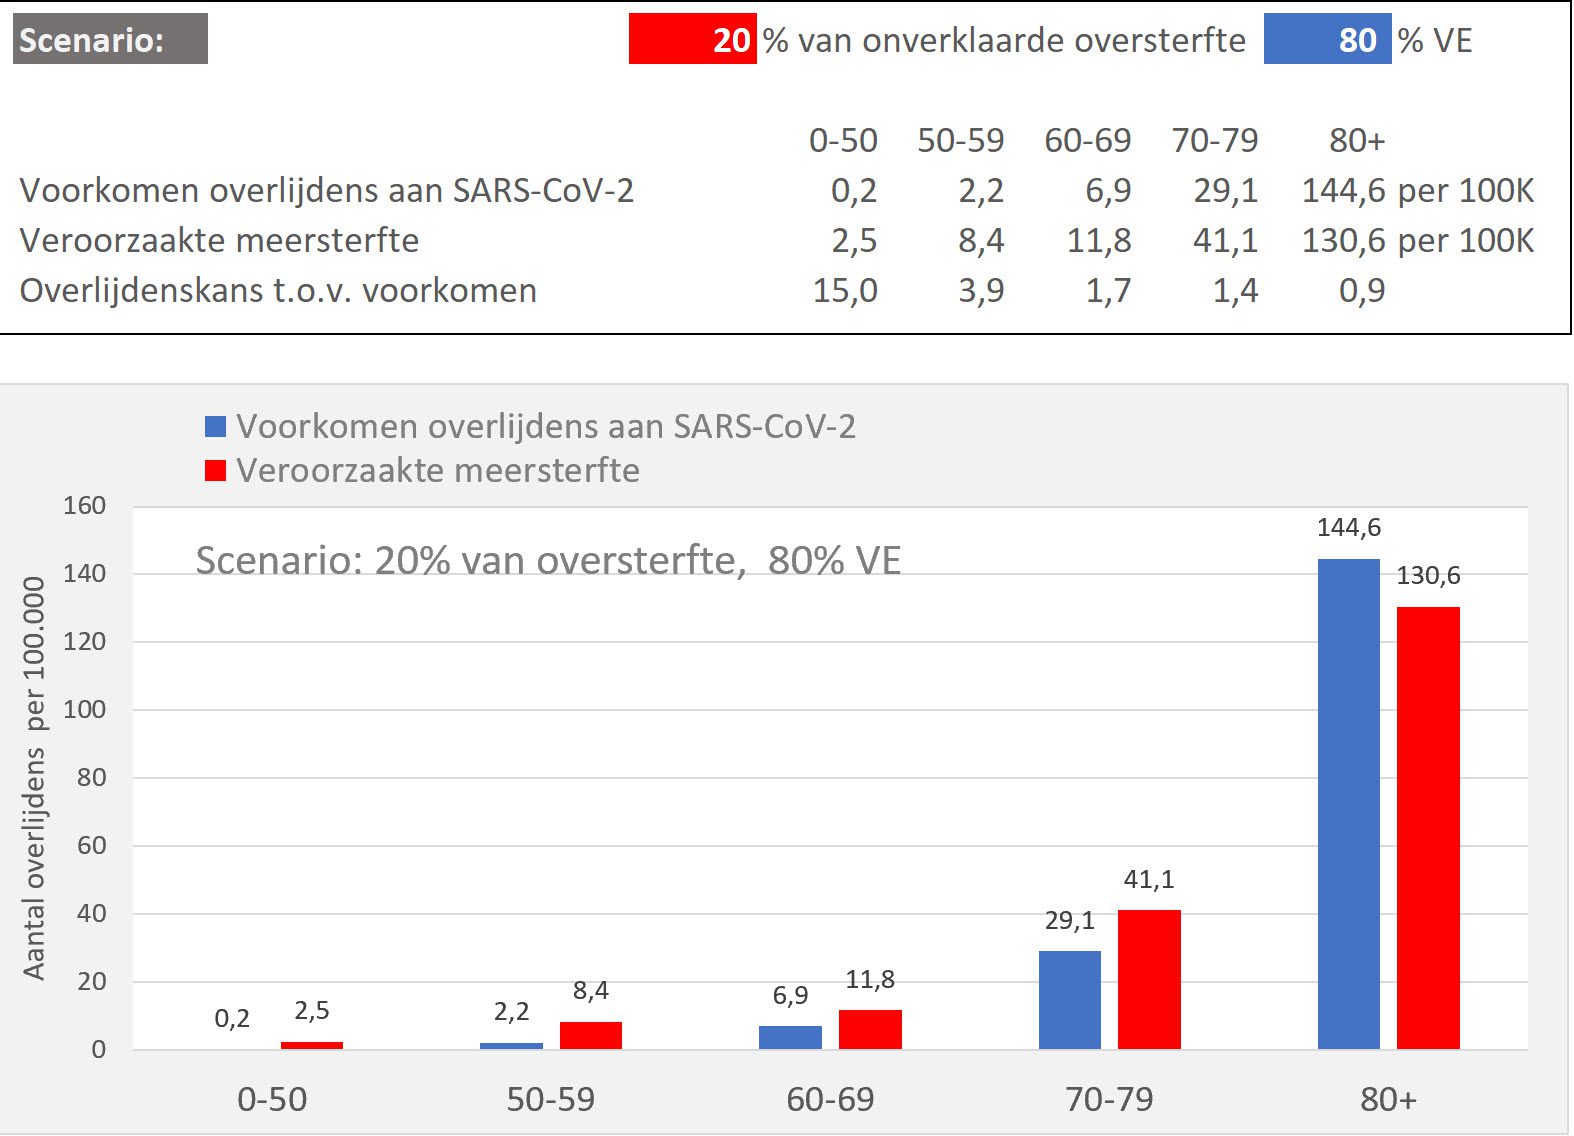
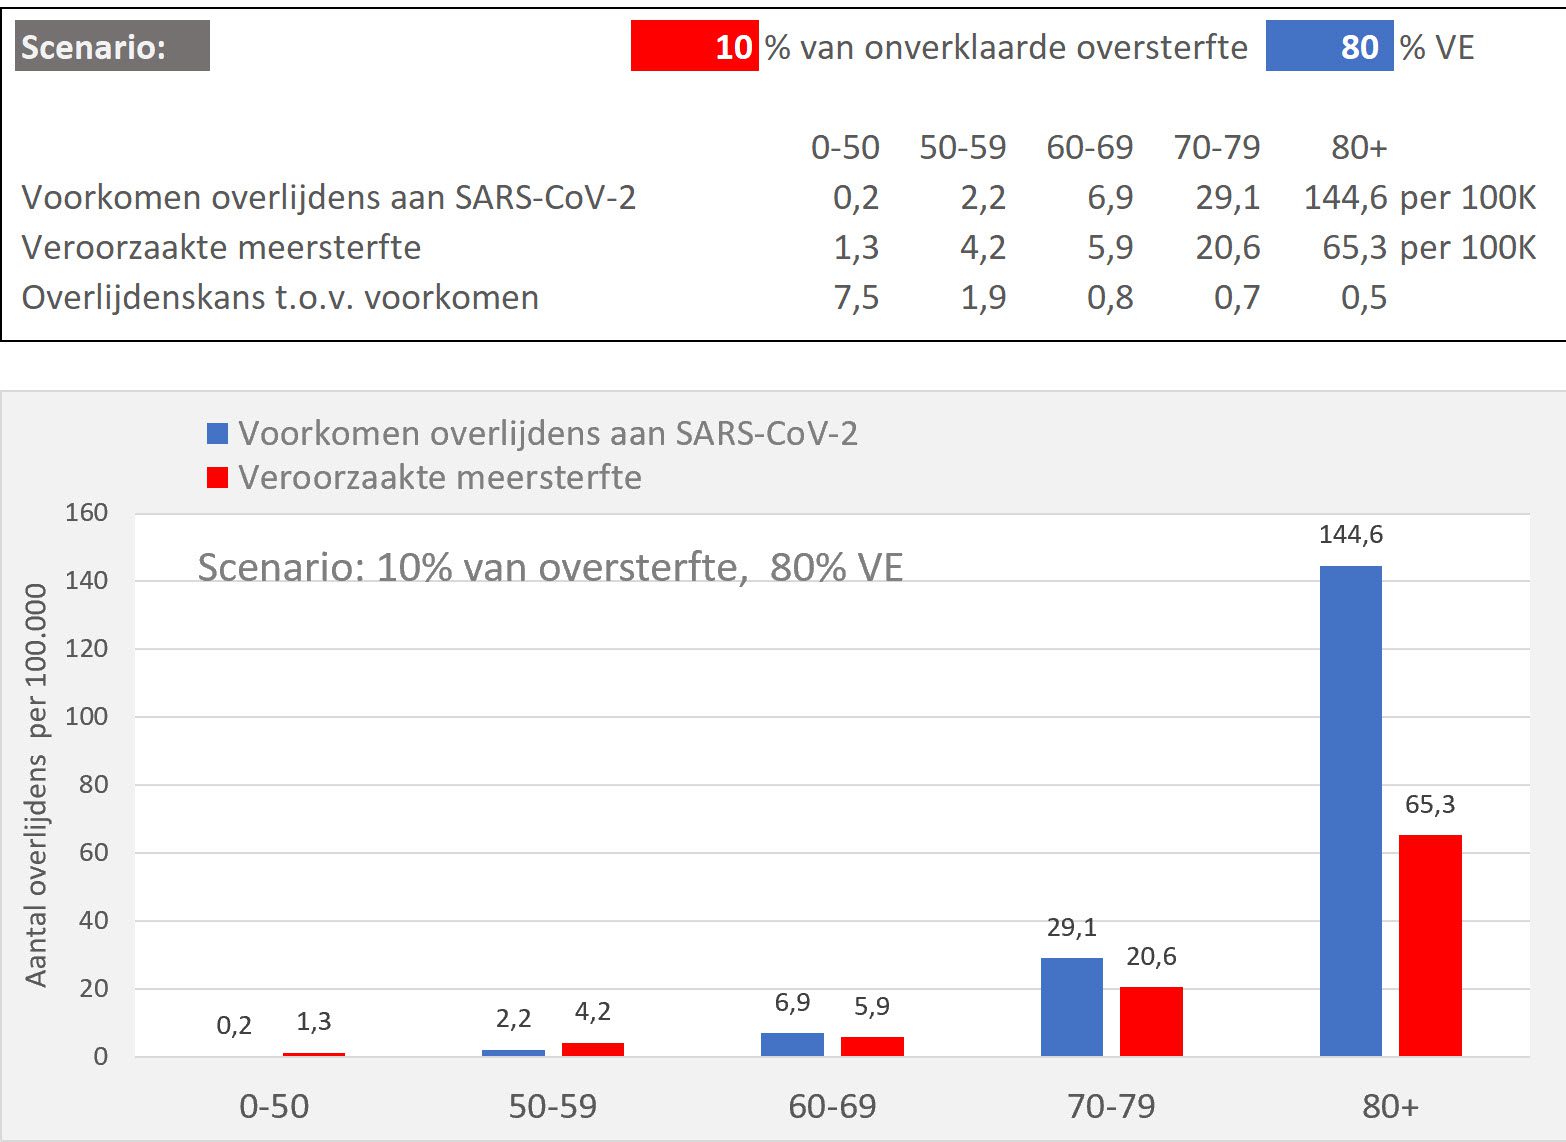
We also enable you to calculate different scenarios on your own. If you download the Excel file below, you can make this table and graph with your own input.
Download this Excel sheet: VE Calculation Scenario and Mortality Increase Version 1.0


